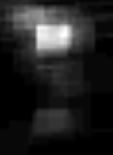

One of the first things I want to do is visualise the image viewing behaviour of users. There are a number of factors to be visualised, and the easiest is simply popularity.
The server logs on Godzilla are transformed by some Perl scripts into
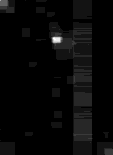
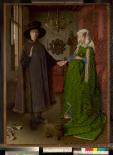
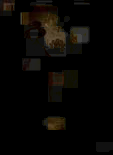
gray image data. The lighter areas in the image represent areas of the
picture (which is shown for comparison, far right) which have received
the most "hits".
|
|
|
|
| Low res | Mid res | High res | Original |
 |
 |
 |
|
| Low res | Mid res | High res | Original |